Treasury Yields & the Market
Hi Roy! News anchors love to say "the 10-year yield jumped today." This short lesson explains what that means and why the whole market pays attention.
You'll learn five things: what Treasury yields are, what pushes them up or down, how rising yields affect stocks and loans, how to read the yield curve, and a simple worked example.
Education only. This is not financial advice. Investing involves risk, including loss of money.
What is a Treasury yield?
When you buy a Treasury, you're lending money to the U.S. government. In return, it pays you interest and gives your money back on a set date (the maturity).
- Bills mature in one year or less.
- Notes mature in 2, 3, 5, 7, or 10 years.
- Bonds mature in 20 or 30 years.
The yield is the yearly return you'd earn if you bought at today's price and held to maturity. The ones you'll hear about most are the 2-year, 5-year, 10-year and 30-year. The 10-year is the big headline number.
The key rule: yield and price move on a seesaw. When a bond's price goes down, its yield goes up, and the other way around.
A bond pays a fixed $40 a year in interest.
Same $40, lower price, so a higher yield. (This simple "current yield" leaves out the gain at maturity, but the direction is the same.)
What pushes yields up or down?
Yields change every day as investors buy and sell Treasuries. Five big forces are behind the moves:
- Fed rate expectations. If people expect the Federal Reserve to raise its short-term rate, yields tend to rise. Expected cuts tend to pull them down. Shorter maturities like the 2-year react most.
- Inflation. Lenders want a higher yield when they expect prices to rise faster, so inflation fears push yields up.
- Economic growth. Strong growth usually lifts yields. Signs of slowing usually lower them.
- Supply and demand. If the government borrows more by selling lots of new Treasuries, and buyers aren't as eager, yields may need to rise to attract them.
- Flight to safety. During scares, investors often sell riskier assets and buy Treasuries. That buying lifts prices and lowers yields.
What rising yields do to the market
Treasuries are often treated as the "safe" baseline rate, so when their yields change, lots of other things tend to move with them:
- Stocks. Higher yields mean safe bonds pay more, so bonds compete with stocks for money. Investors also value future profits with a higher discount rate, so profits far in the future are worth less today. That hits growth and tech stocks hardest, because much of their value depends on profits years away.
- Existing bonds. Their prices fall, because new bonds pay more. Longer-term bonds drop the most.
- Mortgages and loans. 30-year mortgage rates roughly track the 10-year yield (usually about 1.5 to 3 percentage points above it). Rising yields often mean costlier mortgages, car loans and business loans.
- The dollar. Higher U.S. yields can draw in money from abroad, which tends to strengthen the dollar.
- Investor behavior. Some investors rotate out of stocks into bonds or cash. When yields fall, the reverse often happens: bonds pay less, so money tends to flow back toward stocks.
The yield curve: normal vs. inverted
The yield curve is a line connecting yields from short to long maturities. Normally it slopes up: tying your money up for longer usually pays more.
Sometimes it inverts: short-term yields rise above long-term ones. A common check is "2s10s", the 10-year yield minus the 2-year yield. If that number is negative, the curve is inverted.
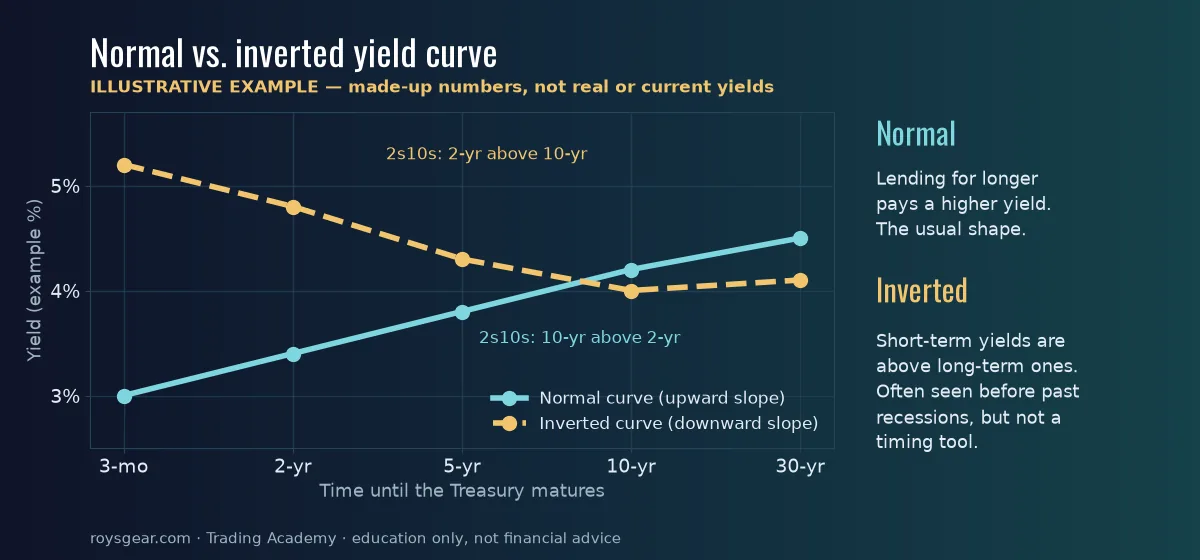
Why people watch it: an inversion often means investors expect the Fed to cut rates later because the economy may weaken. Inversions came before most U.S. recessions of the past 50+ years, often by several months to about two years.
Putting it together: a worked example
Let's walk through one made-up scenario, step by step.
| What happens | 10-year rises 4.0% → 4.8% |
|---|---|
| Safe bond vs. stocks | A safe 4.8% now looks better next to a stock you hope returns, say, 8%. The extra reward for stock risk shrinks. |
| Future earnings | Discounted at a higher rate, so they're worth less today. |
| Tech & growth stocks | Tend to fall more than the overall market. |
| Mortgage rates | Tend to rise, so home loans cost more. |
| Existing bonds | Prices fall (the seesaw). |
Now reverse it. If the 10-year falls from 4.8% back to 4.0%, safe bonds pay less, future earnings are worth more today, growth stocks often lead the way up, mortgage rates tend to ease, and existing bond prices rise.
Your score
Quick recap
- Treasuries are loans to the U.S. government: bills (1 year or less), notes (2 to 10 years), and bonds (20 or 30 years).
- Seesaw: bond price up means yield down, and price down means yield up.
- Drivers: Fed expectations, inflation, growth, supply and demand, and flight to safety.
- Rising yields tend to weigh on stocks (growth and tech most), lower existing bond prices, lift mortgage and loan rates, and support the dollar. Some money rotates into bonds or cash.
- Falling yields tend to do the reverse.
- Yield curve: normally slopes up. An inverted 2s10s curve often came before past recessions, but it's not a timing tool. 2022-2024 inverted without a recession right away.
- All numbers here were illustrative examples. Check an official source for real yields.
Not financial advice. This lesson is for education only. Markets are complex, and the relationships described here are general tendencies that don't always hold.
Sources
- treasurydirect.gov/marketable-securities/treasury-bills/
- treasurydirect.gov/marketable-securities/treasury-notes/
- treasurydirect.gov/marketable-securities/treasury-bonds/
- investor.gov/…/bonds (bond prices and interest rates move in opposite directions)
- sec.gov/files/ib_interestraterisk.pdf (SEC investor bulletin: interest rate risk)
- newyorkfed.org/research/capital_markets/ycfaq (yield curve as a leading indicator)
- fred.stlouisfed.org/series/T10Y2Y (10-year minus 2-year spread, for real data)
- freddiemac.com/pmms (weekly 30-year mortgage rate survey)
Checked September 28, 2026.